
Which US airports handle the most passengers? The Federal Aviation Administration (FAA) publishes an official answer every year, based on how many passengers board flights at each airport. For 2025, the top three are Atlanta, Dallas Fort Worth and Chicago O’Hare.
Quick answer: according to the FAA calendar year 2025 data, Hartsfield-Jackson Atlanta is the busiest airport in the United States with 51.5 million enplanements (passengers boarding), followed by Dallas Fort Worth (41.3 million), Chicago O’Hare (40.7 million), Denver (40.0 million) and Los Angeles (36.5 million).
Below is the full top 30, the biggest winners and losers of 2025, what “hub size” means, and why these numbers differ from the global rankings in our list of the busiest airports in the world.
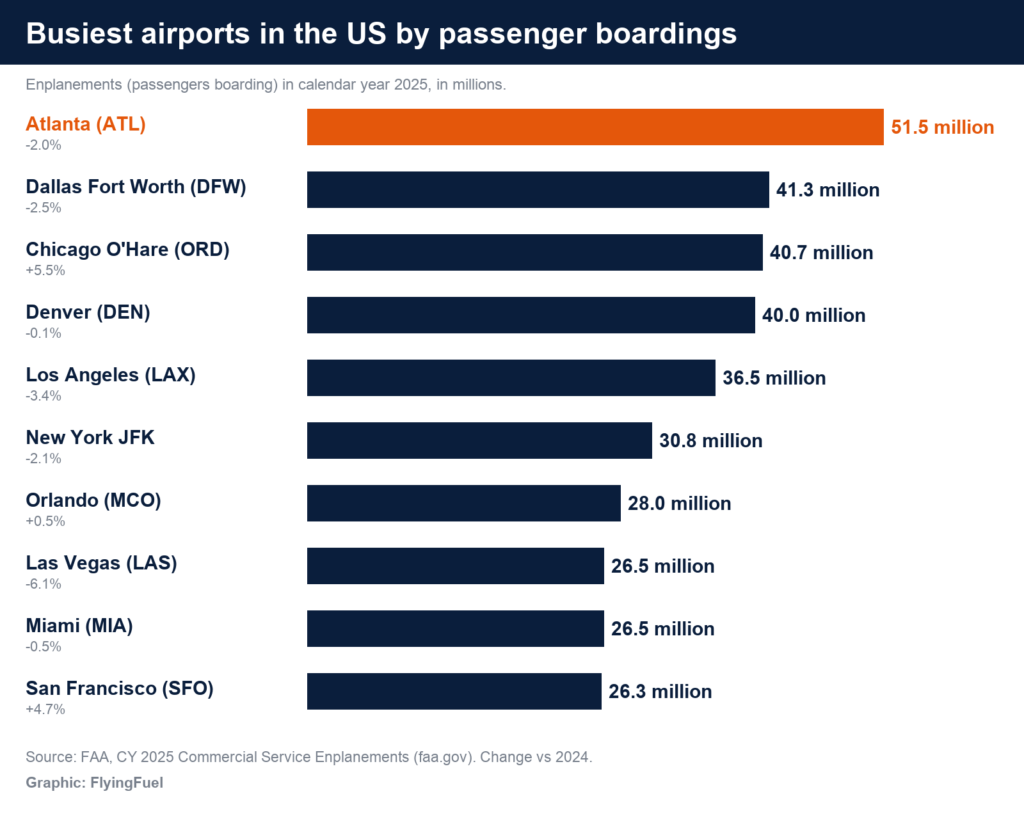
Top 30 Busiest Airports in the US (2025)
| Rank | Airport | City, state | 2025 enplanements | Change vs 2024 |
|---|---|---|---|---|
| 1 | Hartsfield-Jackson Atlanta International (ATL) | Atlanta, GA | 51,459,786 | -2.0% |
| 2 | Dallas Fort Worth International (DFW) | Fort Worth, TX | 41,297,009 | -2.5% |
| 3 | Chicago O’Hare International (ORD) | Chicago, IL | 40,680,735 | +5.5% |
| 4 | Denver International (DEN) | Denver, CO | 39,976,695 | -0.1% |
| 5 | Los Angeles International (LAX) | Los Angeles, CA | 36,497,303 | -3.4% |
| 6 | John F. Kennedy International (JFK) | New York, NY | 30,792,806 | -2.1% |
| 7 | Orlando International (MCO) | Orlando, FL | 27,999,709 | +0.5% |
| 8 | Harry Reid International (LAS) | Las Vegas, NV | 26,531,765 | -6.1% |
| 9 | Miami International (MIA) | Miami, FL | 26,450,972 | -0.5% |
| 10 | San Francisco International (SFO) | San Francisco, CA | 26,251,850 | +4.7% |
| 11 | Charlotte Douglas International (CLT) | Charlotte, NC | 25,873,555 | -9.3% |
| 12 | Seattle-Tacoma International (SEA) | Seattle, WA | 25,417,071 | 0.0% |
| 13 | Phoenix Sky Harbor International (PHX) | Phoenix, AZ | 25,094,817 | -2.0% |
| 14 | Newark Liberty International (EWR) | Newark, NJ | 23,464,492 | -4.4% |
| 15 | George Bush Intercontinental (IAH) | Houston, TX | 23,265,028 | -0.4% |
| 16 | Boston Logan International (BOS) | Boston, MA | 21,021,153 | -0.3% |
| 17 | Minneapolis-St Paul International (MSP) | Minneapolis, MN | 17,488,261 | -3.1% |
| 18 | Detroit Metropolitan Wayne County (DTW) | Detroit, MI | 16,294,768 | +1.1% |
| 19 | LaGuardia (LGA) | New York, NY | 16,278,532 | -2.6% |
| 20 | Fort Lauderdale-Hollywood International (FLL) | Fort Lauderdale, FL | 15,646,752 | -8.5% |
| 21 | Philadelphia International (PHL) | Philadelphia, PA | 14,779,849 | -2.1% |
| 22 | Washington Dulles International (IAD) | Dulles, VA | 13,859,569 | +6.6% |
| 23 | Salt Lake City International (SLC) | Salt Lake City, UT | 13,429,128 | -0.8% |
| 24 | San Diego International (SAN) | San Diego, CA | 12,675,684 | -0.8% |
| 25 | Nashville International (BNA) | Nashville, TN | 12,549,304 | +4.1% |
| 26 | Baltimore/Washington International (BWI) | Baltimore, MD | 12,274,134 | -7.2% |
| 27 | Tampa International (TPA) | Tampa, FL | 12,110,427 | +0.3% |
| 28 | Ronald Reagan Washington National (DCA) | Arlington, VA | 12,003,594 | -5.9% |
| 29 | Austin-Bergstrom International (AUS) | Austin, TX | 10,651,727 | -0.3% |
| 30 | Daniel K. Inouye International (HNL) | Honolulu, HI | 10,430,353 | -0.2% |
Source: FAA, CY 2025 Commercial Service Enplanements (Excel). Enplanements are passengers boarding; changes are from the FAA file.
The Top 5, One by One
1. Atlanta (ATL): 51.5 million
Atlanta is the busiest airport in the US, and ACI also ranks it the busiest in the world. In 2025 it boarded 51.5 million passengers, about 10 million more than any other US airport, even though its traffic fell 2.0%.
2. Dallas Fort Worth (DFW): 41.3 million
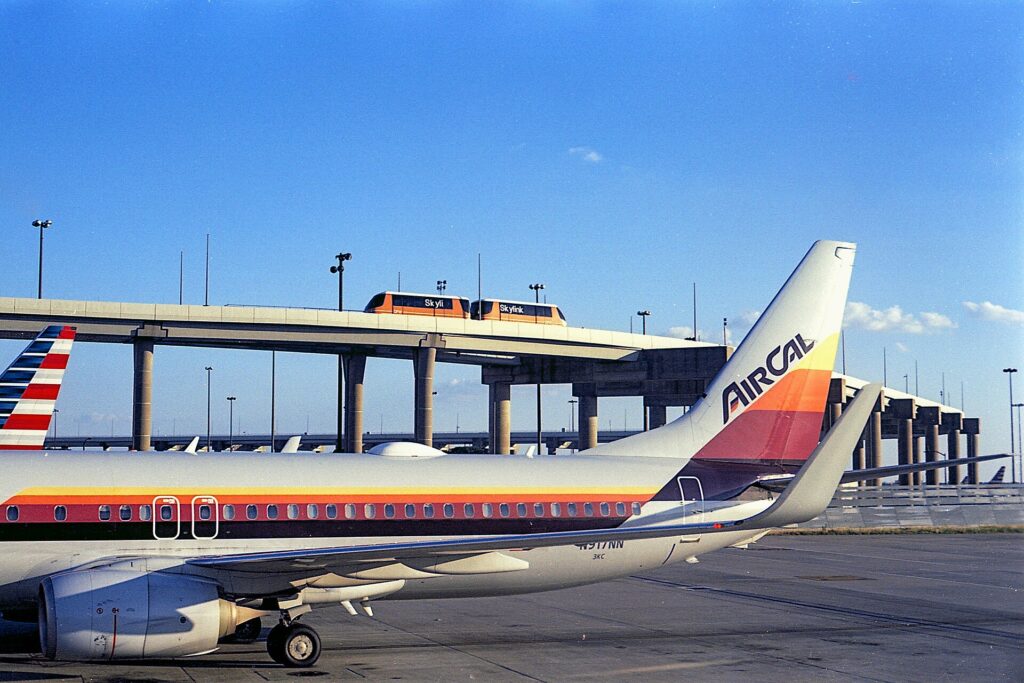
DFW boarded 41.3 million passengers, down 2.5%. Its terminals are linked by the Skylink people mover, seen in the photo below.
3. Chicago O’Hare (ORD): 40.7 million
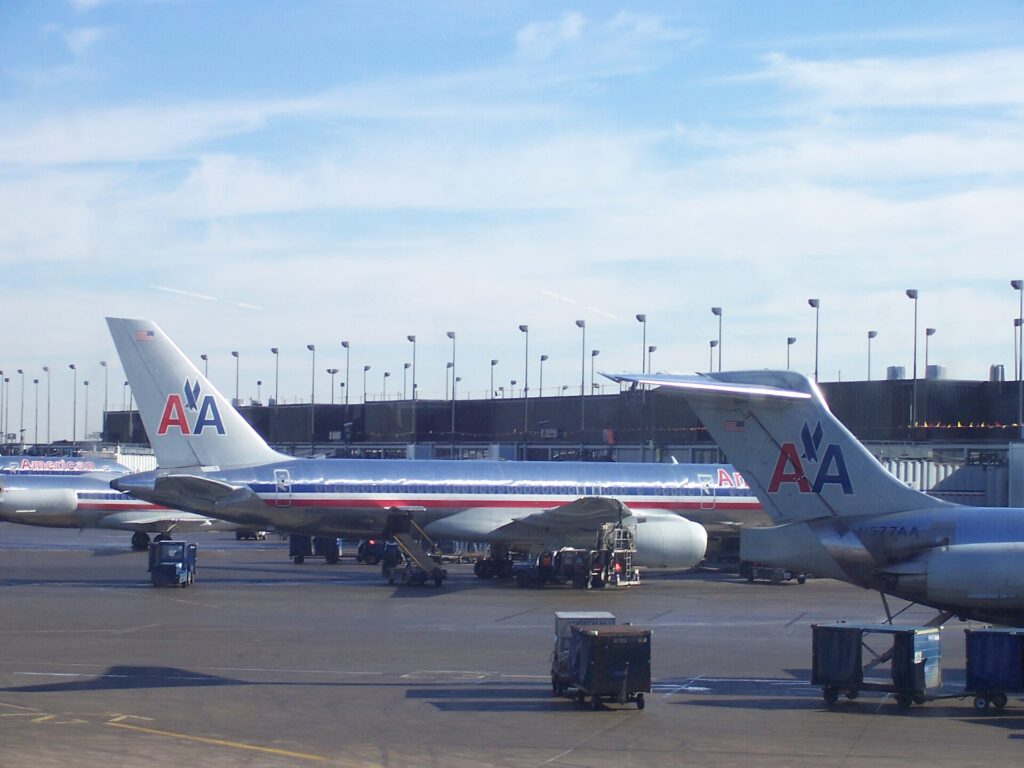
O’Hare was the big mover of 2025 among the top five: up 5.5% to 40.7 million, which kept it just ahead of Denver in third place.
4. Denver (DEN): 40.0 million
Denver held almost steady at 40.0 million (-0.1%), just behind O’Hare.
5. Los Angeles (LAX): 36.5 million
LAX boarded 36.5 million passengers, down 3.4%, and remains the busiest airport on the West Coast.
Winners and Losers of 2025
| Biggest growth (large hubs) | Change | Biggest falls (large hubs) | Change |
|---|---|---|---|
| Washington Dulles (IAD) | +6.6% | Charlotte (CLT) | -9.3% |
| Chicago O’Hare (ORD) | +5.5% | Fort Lauderdale (FLL) | -8.5% |
| San Francisco (SFO) | +4.7% | Baltimore/Washington (BWI) | -7.2% |
| Nashville (BNA) | +4.1% | Las Vegas (LAS) | -6.1% |
| Detroit (DTW) | +1.1% | Washington National (DCA) | -5.9% |
Overall, US air travel slipped slightly. By our sum of the FAA file, commercial service airports recorded about 973 million enplanements in 2025, about 1% fewer than in 2024. The FAA data does not explain why individual airports grew or fell, so we do not guess here; airline schedule changes often explain big swings at a single airport.
What Are Large, Medium and Small Hubs?
The FAA uses enplanements to sort commercial service airports into categories: large hub, medium hub, small hub and nonhub primary airports. These categories decide how federal Airport Improvement Program money is shared; calendar year 2025 data sets each airport’s category and funding for fiscal year 2027.
- 30 large hubs in the 2025 data, from Atlanta down to Honolulu, handled about 70% of all boardings (our calculation).
- 35 medium hubs, such as Chicago Midway, Portland and Raleigh-Durham, follow.
- The top 10 airports alone handled about 36% of all boardings.
Busiest Airport in Each Major State
| State | Busiest airport | US rank | 2025 enplanements |
|---|---|---|---|
| Georgia | Atlanta (ATL) | 1 | 51.5 million |
| Texas | Dallas Fort Worth (DFW) | 2 | 41.3 million |
| Illinois | Chicago O’Hare (ORD) | 3 | 40.7 million |
| Colorado | Denver (DEN) | 4 | 40.0 million |
| California | Los Angeles (LAX) | 5 | 36.5 million |
| New York | New York JFK | 6 | 30.8 million |
| Florida | Orlando (MCO) | 7 | 28.0 million |
| Nevada | Las Vegas (LAS) | 8 | 26.5 million |
| North Carolina | Charlotte (CLT) | 11 | 25.9 million |
| Washington | Seattle-Tacoma (SEA) | 12 | 25.4 million |
| Arizona | Phoenix (PHX) | 13 | 25.1 million |
| New Jersey | Newark (EWR) | 14 | 23.5 million |
| Massachusetts | Boston (BOS) | 16 | 21.0 million |
| Minnesota | Minneapolis-St Paul (MSP) | 17 | 17.5 million |
| Michigan | Detroit (DTW) | 18 | 16.3 million |
| Pennsylvania | Philadelphia (PHL) | 21 | 14.8 million |
| Virginia | Washington Dulles (IAD) | 22 | 13.9 million |
| Utah | Salt Lake City (SLC) | 23 | 13.4 million |
| Tennessee | Nashville (BNA) | 25 | 12.5 million |
| Maryland | Baltimore/Washington (BWI) | 26 | 12.3 million |
| Hawaii | Honolulu (HNL) | 30 | 10.4 million |
| Oregon | Portland (PDX) | 32 | 9.1 million |
| Missouri | St. Louis (STL) | 35 | 7.5 million |
| Louisiana | New Orleans (MSY) | 39 | 6.2 million |
| Alaska | Anchorage (ANC) | 59 | 2.7 million |
Source: FAA CY 2025 enplanements; FlyingFuel selection of the top airport in each state listed. Florida is the only state with three airports in the top 20 (Orlando, Miami and Fort Lauderdale).
Two-Airport (and Three-Airport) Cities
- New York area: JFK (30.8 million), Newark (23.5 million) and LaGuardia (16.3 million) together boarded about 70.5 million passengers, more than Atlanta, though JFK alone ranks 6th.
- Washington, DC area: Dulles (13.9 million), BWI (12.3 million) and Reagan National (12.0 million), about 38.1 million combined.
- Chicago: O’Hare (40.7 million) plus Midway (9.4 million).
- Dallas: DFW (41.3 million) plus Dallas Love Field (8.2 million).
- Houston: Bush Intercontinental (23.3 million) plus Hobby (6.8 million).
Combined totals are FlyingFuel sums of the FAA figures.
FAA vs ACI: Why the Numbers Differ
If you have seen Atlanta listed with over 100 million passengers, that is not a contradiction. The FAA counts enplanements, passengers getting on planes. Airports Council International (ACI), whose ranking we use in our world airports list, counts total passengers, arrivals plus departures, which put Atlanta at about 106.3 million in 2025. Roughly speaking, total passengers are about twice the enplanements.
For comparison, India’s busiest airport, Delhi, handled 78.7 million total passengers in its 2025-26 financial year; see our largest airports in India ranking.
Tips for Flying Through the Busiest US Airports
- Get through security faster: see our TSA PreCheck vs Global Entry guide.
- Bring the right ID: read our REAL ID guide before you fly.
- Allow time for connections: at large hubs, moving between concourses can mean long walks or a train ride.
- Know your rights: if your flight is cancelled or badly delayed, see our guide to US refund rules.
Key Takeaways
- Atlanta is the busiest US airport, with 51.5 million enplanements in 2025.
- Dallas Fort Worth, Chicago O’Hare, Denver and Los Angeles complete the top five.
- O’Hare (+5.5%), Dulles (+6.6%) and San Francisco (+4.7%) grew; Charlotte, Fort Lauderdale and BWI fell most.
- The 30 large hubs handle about 70% of US boardings.
- FAA counts boardings only; ACI counts arrivals plus departures, so its numbers are about double.
Frequently Asked Questions
What is the busiest airport in the United States?
Hartsfield-Jackson Atlanta International Airport. The FAA counted 51.5 million passenger boardings (enplanements) there in 2025, about 10 million more than second-placed Dallas Fort Worth.
What are the top 5 busiest airports in the US?
By 2025 FAA enplanements: Atlanta (51.5 million), Dallas Fort Worth (41.3 million), Chicago O’Hare (40.7 million), Denver (40.0 million) and Los Angeles (36.5 million).
What is an enplanement?
A passenger boarding a flight. The FAA counts enplanements, so each traveler is counted when they get on a plane, not when they get off. That is why FAA numbers are roughly half of total passenger figures that count both arrivals and departures.
Why are FAA and ACI airport numbers different?
The FAA counts enplanements (boardings only). Airports Council International (ACI) counts total passengers, arriving plus departing. ACI put Atlanta at 106.3 million passengers in 2025, about double the FAA’s 51.5 million boardings.
Which US airports grew the most in 2025?
Among the 30 large hubs, Washington Dulles (+6.6%), Chicago O’Hare (+5.5%), San Francisco (+4.7%) and Nashville (+4.1%) grew the most.
Which big US airports lost passengers in 2025?
Among large hubs, Charlotte (-9.3%), Fort Lauderdale (-8.5%), Baltimore/Washington (-7.2%), Las Vegas (-6.1%) and Washington National (-5.9%) fell the most.
How many large hub airports are there in the US?
The FAA classified 30 airports as large hubs based on 2025 enplanements. Together they handled about 70% of all boardings at US commercial service airports.
Which is the busiest airport in New York?
JFK, with 30.8 million enplanements in 2025, ranked 6th in the US. Newark (23.5 million) and LaGuardia (16.3 million) also rank in the top 20.
Did US air travel grow in 2025?
Slightly down. Our sum of the FAA data shows about 973 million enplanements at commercial service airports in 2025, about 1% fewer than in 2024.
Featured image: FlyingFuel graphic using a photo of Concourse A at Hartsfield-Jackson Atlanta International Airport from the air by formulanone, CC BY-SA 2.0, via Wikimedia Commons.
 Embraer Executive JetsEmbraer Business Jets: Phenom 100EX, Phenom 300EV, Praetor 500E and 600E Explained (2026)
 NewseasyJet to Fit Starlink Wi-Fi Across Its Airbus Fleet From 2027
 NewsFAA Proposes Fan Blade Checks on Every CFM56-7B Engine After 737 Blade Failure
 Dassault FalconDassault Falcon Jets: Every Model From the 2000LXS to the 10X Explained (2026)
 GulfstreamGulfstream Business Jets: Every Model From the G300 to the G800 Explained (2026)
 NewsBombardier to Hire 800 in the US and Spend $270 Million on First Phase of Expansion